In honour of this weekend’s women’s World Cup final, I thought it would be interesting to do a post looking at how the highest level of women’s football in England, the Women’s Super League, compares with the Premier League in terms of levels of competitive inequality. I’ve calculated the same four measurements used in analysis of the top men’s European leagues (fully outlined and explained in this post), then presented a side-by-side comparison of each measure (for every season it is possible to calculate) since the WSL started in 2011.
A few points to have in mind:
Over the period in question, the WSL’s format has gradually evolved, expanding from an eight team league to a league of twelve teams. You are, therefore, dealing with a shorter season than the Premier League.
Because of the smaller league size for the WSL, I haven’t gone beyond the top four when looking at the turnover measure.
The figures listed here for the WSL for 2017 were for a particularly short interim ‘Spring Series’ competition of just eight games, used to bridge a gap caused by a shift in the overall schedule of the playing season from summer to winter.
Results
For each graph, WSL results are shaded light blue and those for the Premier League are shaded darker.
There are some things that can be clearly see from the results:
After a few early years of flux, the WSL has settled into a very similar pattern to that of the men’s game, with high levels of stability (high correlation in finishing positions from season to season, low levels of turnover in top positions) and high levels of dominance by the winners (in terms of points per game and goal difference per game).
In fact, the figures point to unequal competition having become more of a factor in the functioning of the women’s game than the men’s.
In particular, the top positions of the WSL have been dominated by three teams: Chelsea, Man City and Arsenal. In fact, 2023 marked the first occasion since 2014 that one of these teams finished out of the top three — Man City were fourth, as a result of Man Utd finishing second.
The WSL champions consistently achieve better goal difference than those of the Premier League, built upon large numbers of easy wins. The pinnacle of this was the 2017 Spring Series mentioned above: in the eight games they played, champions Chelsea recorded two 7-0 wins, one 6-0 win and two 4-0 wins.
What can we learn from this?
Unequal access to resources is just as much of an issue for the state of competition within women’s football in England as it is in the men’s game, even if the financial standing of the two leagues are very different. Absurd money is not sloshing around the WSL in the manner it does in the Premier League. In fact, women’s teams remain largely dependent upon their affiliated men’s clubs for much of their funding, which means affiliation with a wealthy Premier League men’s side is becoming almost a prerequisite for any sort of success. Indeed, in the 2022-23 season, the only WSL side not backed by a Premier League team was Reading, who finished bottom and were relegated, after which financial constraints have led them to switch from fully professional to part-time status.
What this also helps to show is that the level of effective competition within a league is not a function of the absolute levels of resources it has access to, but rather as a result of how resources are spread within the clubs in the league. The Premier League has not got less competitive in the past couple of decades because of the increased wealth of its clubs, but rather because of the inequality in resources that has created various levels of hierarchy between those at the top and those lower down. Meanwhile, WSL teams have experienced varying levels of success because some clubs have been quicker and more lavish in the investment they have dedicated to their women’s teams.
The good news for the WSL is that its problems seem easier to remedy, as the ongoing development of the women’s game (aided by, at the very least, a World Cup final appearance) is likely to make more Premier League clubs come to see the benefits of investing in a women’s team, meaning that more teams may be given the resources to challenge in future. The scale of the disparities in the men’s game, meanwhile, feel like far more of a daunting obstacle toward the delivery of a healthily competitive Premier League.
To mark the start of the 2023/24 Premier League season, let’s briefly step aside from the sportswashing posts to assess how this season might go:
A few things to note:
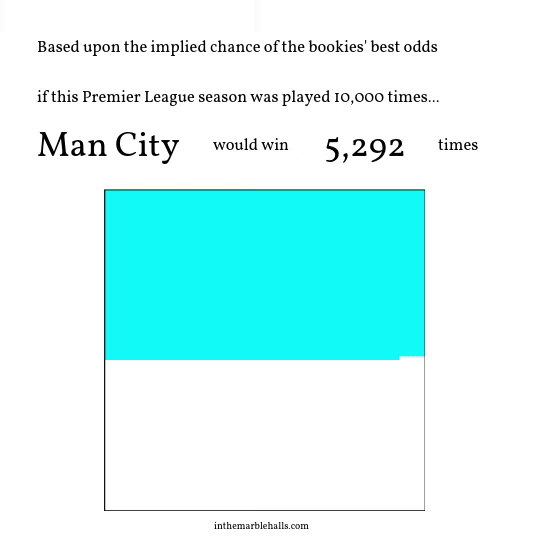
Bookmakers are a little gun-shy on outsiders since Leicester’s incredible 2016 victory. No club this year is given the 5000-1 odds the Foxes won with that season — Luton are the least favoured team this year at 3000-1.
Just seven teams are given greater than a 1% chance of success: the financially mighty six sides who signed up for the European Super League, added to by Newcastle and their Saudi-stocked coffers.
Only nine of the twenty teams have better than a 0.15% chance of victory. The seven above plus Brighton and Aston Villa.
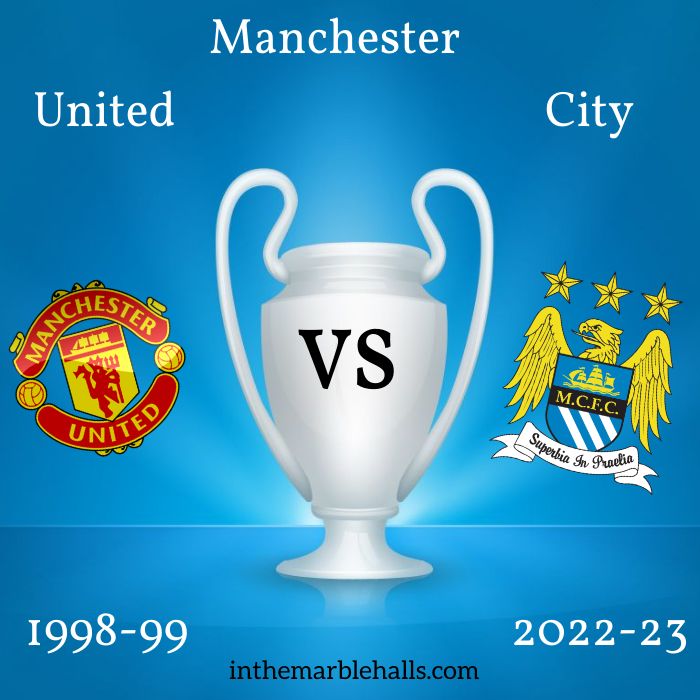
In a comparison, who’s better: Manchester City of 2022-23 or Manchester United of 1998-99?
In the red corner: coming from an era of dominance in the 1990s to claim their fifth Premier League title in seven years (their 12th champion’s crown overall), their tenth FA Cup victory and their second European Cup. A vibrant and tenacious side featuring the graduates of the famed Class of 92 (Giggs, Scholes, Beckham, the Nevilles, Butt), alongside Roy Keane, Dwight Yorke, Jaap Stam, Peter Schmeichel and Andy Cole, all driven by perhaps the best manager of all time, Alex Ferguson.
In the blue corner: capping their own era of recent dominance with a fifth league title in six years (a ninth overall), lifting the FA Cup for a seventh time and taking a first European Cup victory. Tactically meticulous and finely honed under Pep Guardiola, with technical virtuosity throughout the team in the likes of Kevin De Bruyne, Rodri, Bernardo Silva and Ilkay Gundogan, fronted by the bulldozing goalscoring prowess of Erling Haaland.
So how do you decide..?
One approach you could take would be to consider each side’s best eleven, player-by-player, and through some arbitrarily subjective rating system try to uncover which was superior. That’s the angle taken in this piece in the Telegraph, which declares the United eleven to be better by a quarter of a point (although, if you read the opening blurb, you find these exact line-ups started precisely five games between them across the two seasons). Well, I guess it drives engagement, eh…
But, what can a comparison of the two teams tell us about what it means to be a dominant team in their respective eras? Rather than simply seeing it as a contest, can we use a comparison to better understand the state of English football then and now?
Let’s start with some comparisons of the respective performance of each team in their treble-winning season.
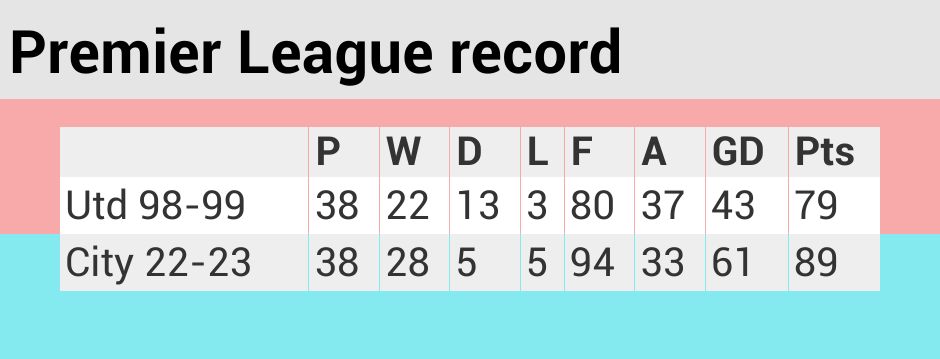
Premier League
Here, there’s a clear edge to City’s performance: they won more games, achieved a higher points tally, scored more goals and were stingier defensively. United, though, proved harder to beat, only losing three games all season.
There are, also, similarities with the way both seasons played out. Neither team won from the front: both were behind the top spot at Christmas, but hit rich spells of form as the season progressed – United’s last defeat was on the 19th December, City won 12 straight games from February until the title was wrapped-up. Both ultimately triumphed over Arsenal to take their title: City won theirs with three games to spare, while United had to record a final day victory at Tottenham to see off the Gunners.
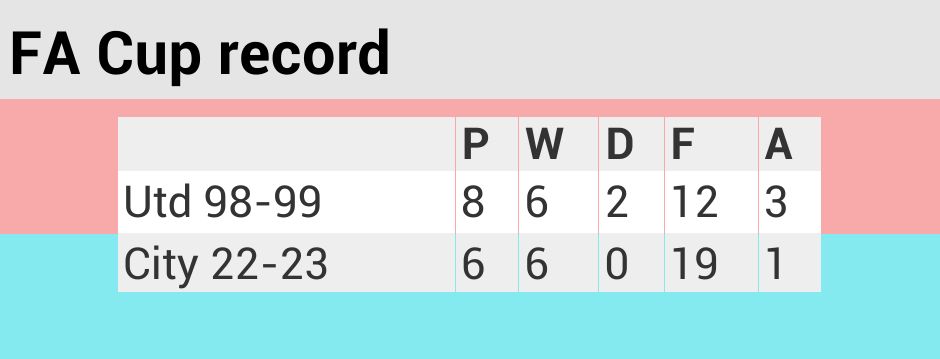
FA Cup
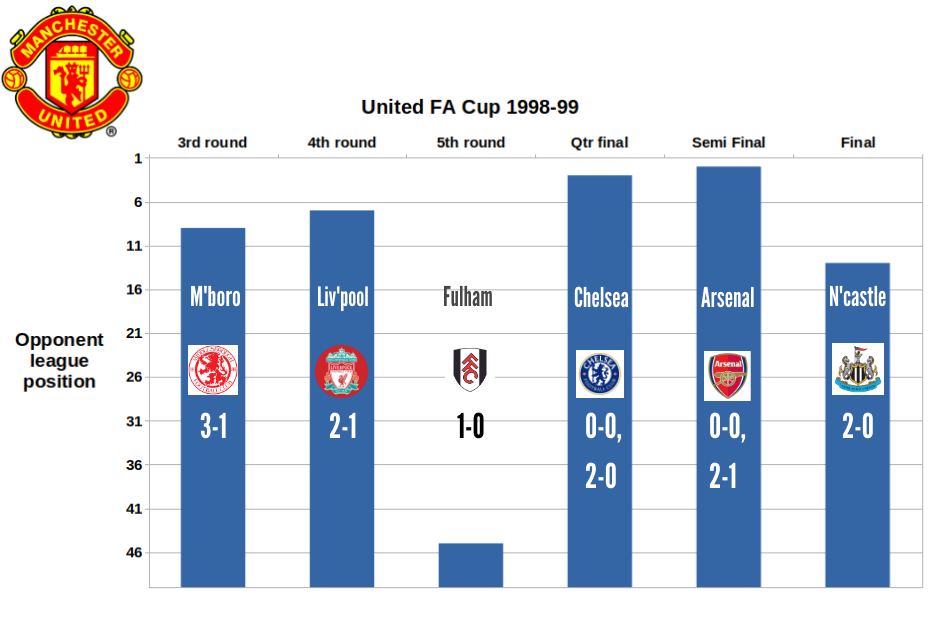
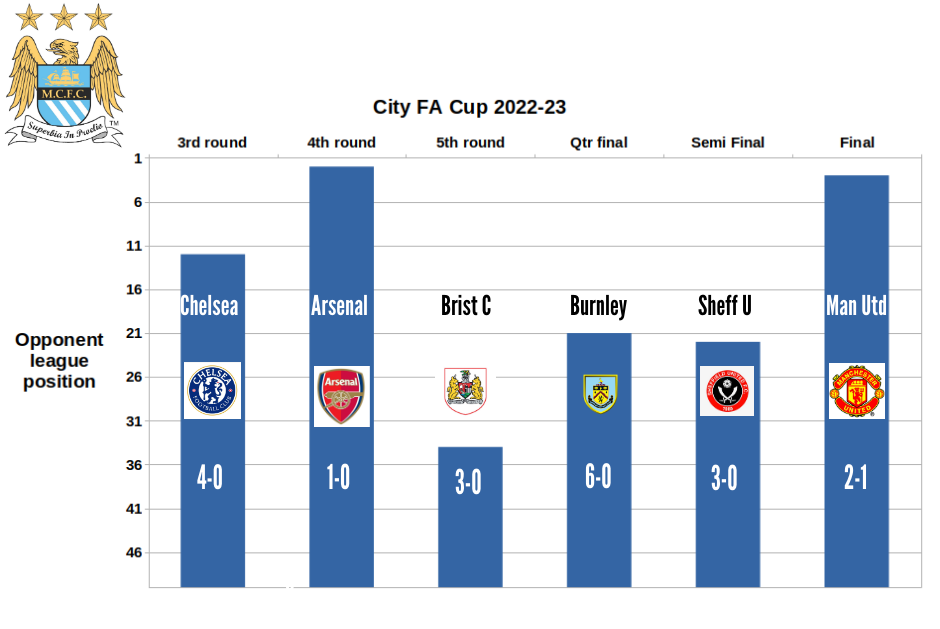
Of course, as victors of a knockout trophy, here neither lost a game. City again, though, show greater dominance in respect to goals scored and conceded over their cup run, while United required replays to overcome Chelsea in the quarter-final and Arsenal in the semi-final (the momentous game in which Keane was sent off, Schmeichel saved a Bergkamp penalty in injury-time, before being settled by Ryan Giggs’s memorable weaving dart through the Arsenal backline and ecstatic hairy-chested, shirt-waving celebration in extra-time).
Although, with any cup run, who you are drawn against can make a big difference, so it is worth looking at the respective cup runs, to see where across the league each of their respective opponents finished.
Here, United probably had the harder path, with four of their six opponents being top half finishers in the Premier League. Interestingly, both City and United had to overcome the teams who finished 2nd and 3rd in the Premier League on their way to the trophy.
Another feature common to both cup runs was facing teams who were having great success in lower divisions: City faced the teams who finished 1st and 2nd in last year’s Championship table, dispatching both of them comfortably; United’s sole lower division challenger was Fulham, at that point on their way to a 101 point season in the third tier under Kevin Keegan, as Mohamed Al-Fayed’s millions began to push them towards the Premier League.
One respect in which both City and United were both lucky was in being given more home than away fixtures: United were drawn at home all the way to the neutrally hosted semi-final (although they still needed to win away once, in a quarter-final replay at Chelsea); City’s only away tie was against Bristol City – the lowliest side they faced.
Champions League
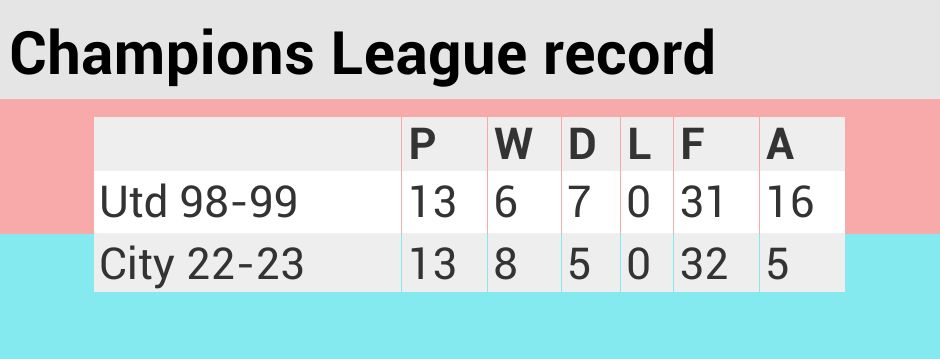
Both teams went through all stages of the competition unbeaten, with City shading things on their overall record. While both sides played thirteen matches in their campaign, for United, this was only due to their need to play a qualifying tie prior to the group stage, beating ŁKS Łódź 2-0 over two legs. The expanded format of the competition required City instead to play four two-leg knockout ties after the group stage, compared to just three for United.
United were a swashbuckling side across the 1998-99 European campaign, frequently involved in high scoring games. Highlights included two 3-3 draws with Barcelona and a 6-2 win over Brøndby in Copenhagen in the group stage, alongside a thrilling 3-2 win over Juventus in Turin (when Roy Keane put in a career-capping performance to drag them back from an early 2-0 deficit) that took them to the final.
City’s Champions League victory was more of a pulverising experience – they simply ground opponents into the dust. This was particularly the case across the knockout phase as RB Leipzig, Bayern Munich then Real Madrid were dispatched 8-1, 4-1 then 5-1 on aggregate.
There is possibly a case that changes in the format of the competition made City’s path through the groups stages easier than that faced by United, as in 1998-99 only two clubs per country gained entry to the tournament. So, while both sides faced groups drawn from exactly the same three leagues (Germany, Spain and Denmark) United’s group contained the eventual German and Spanish league champions in Bayern and Barcelona, whereas City’s opponents ended up finishing second in the Bundesliga (Borussia Dortmund) and twelfth in La Liga (Sevilla).
Even if this was true, though, the ease with which City batted aside the German title winners and the previous Champions League winners in the knockout phase points to a level of dominance over the competition that was never apparent in United’s rollercoaster path to the trophy.
Digging deeper
The above confirms the on-first-sight observations that most fans would have considering the two seasons side-by-side: there was a sense of crushing inevitability about City’s performance last season that wasn’t present in United’s treble of 1998-99. United’s season was thrilling to follow precisely because there were so many high-stakes situations that could have gone in different directions yet, somehow ended up falling the way of Ferguson’s team. With City, instead the impression was of an awesome power that might sometimes briefly be contained, yet was never really at risk of being overcome.
But, does this tell us more about the teams themselves, or about the wider state of competition within the sport?
Context: domestic football
Firstly, we can look at domestic performance in perspective by examining two of the measures of inequality used in the C0mpetitive Inequality Project.
Here first are the charts for points per game and average goal difference per game, with the relevant treble-winning seasons highlighted.
(Bars here represent the individual measure (average points won, average goal difference) per game by the team that finished champions that season. The red line is a five-year rolling average to pick up on trends in the medium term. The dotted line is an overall trendline representing the overall direction of travel for this measure across the results. United’s 1998-99 performance and City’s 2022-23 performance are highlighted. See this post for further discussion of these measurements.)
In terms of points per game, both treble seasons were slightly ‘down years’: performance was lower than many of the surrounding seasons for both teams, while both fell short of the overall dotted trend-line. I guess this shouldn’t be too great a surprise – maintaining a challenge on multiple fronts may require that sometimes league performance dips, due to things like tiredness or squad rotation. (City also had to contend with the disruption caused by a mid-season World Cup.) Goal difference per game figures show this to a slightly lesser extent: United are closer to the trend, while City sit above it, although still below many other recent seasons.
If it is the case that league performance suffers across a season where multiple trophies are won, what would things look like if, rather than comparing the treble winning seasons themselves, we instead look at the peak performance each team achieved (or has achieved so far, in City’s case).
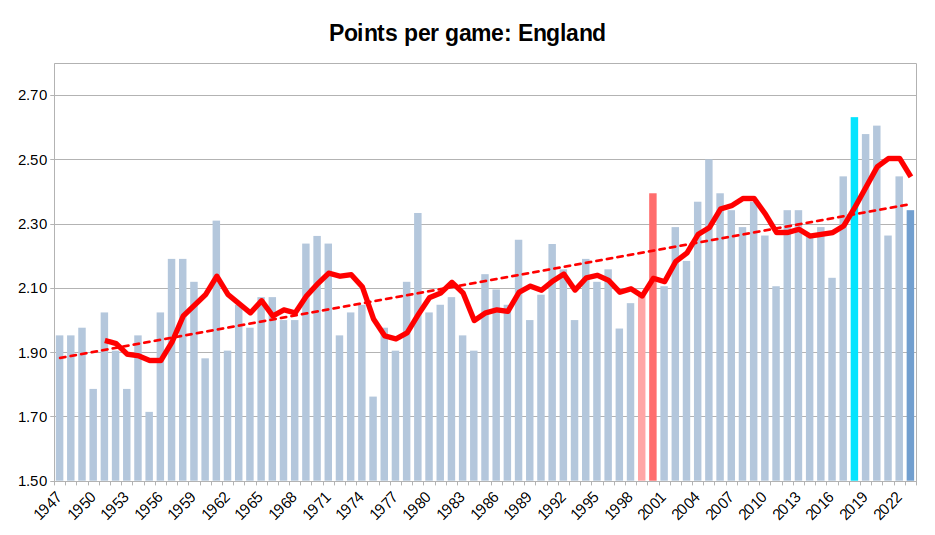
As shown in the darker red here, United followed up their treble with their most impressive league performance under Ferguson, hitting 91 points in 1999-2000. This is above City’s points haul last season and was higher than anything that had come before. However, it has been surpassed on multiple occasions since, including the 2017-18 season (highlighted in sky blue) in which Guardiola’s City reached 100 points to set the current record performance.
Given the overall trend towards higher performance by clubs at the top of the table, it becomes harder to assess teams from different eras, but one thing we can say is that both of these seasons clearly stand out above the dotted trend line (City probably shading things in terms of how far above trend they were), showing that each team at its best was something special.
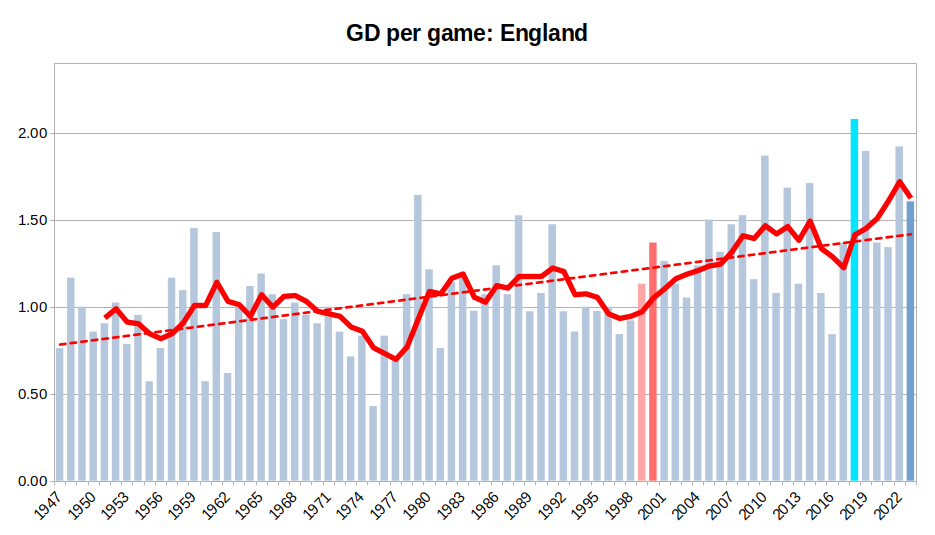
As with the treble-winning seasons, the goal difference per game measure gives a greater edge to City. Even in United’s best league season (by points won), their goal difference only just sits above the trend, while City’s best season is well clear. This gives us a really clear indication of the level of controlled domination that this current City team is able to exhibit: their ability to hold and use possession in a way that allows them to break opponents down without exposing themselves defensively. It also attests to the growing gap between City and the majority of the Premier League in terms of resources available to build a team that most will struggle to live with.
Context: European football
While the difference between the Premier League of 1999 and that of 2023 is great, the differences in European competition – and particularly in English football’s standing vis-a-vis continental football – are probably much bigger. City’s Champions League win this year was the third by an English club in the last five renewals; seven of the last twelve finalists in the competition have been English teams. This is all a far cry from the late 1990s, when English football was still struggling to reassert its importance following its late 1980s exile from European competition as punishment for the involvement of Liverpool fans in the Heysel Stadium disaster.
There had been some success in the European Cup Winners’ Cup: United themselves claiming the trophy in the first year back after the ban in 1990-91, followed by Arsenal in 1993-94 and Chelsea in 1997-98. But the performance of English teams in Europe’s premier club competition remained short of the swaggering dominance they had exercised in the pre-ban era. After the return, none of the first three English participants – Arsenal, then Leeds, then Manchester United – made it into the tournament’s group stage (although, in the nascent experimentation with a group format, the group phase was then at a relatively later point than it would come to occupy as the format became established).
United’s first post-ban appearance ended in memorable, although ignominious, fashion when they were unable to overcome Galatasaray over two legs. The first leg had seen the Turks come back from an early 2-0 deficit to take a 3-2 lead, before a late Cantona goal left things level leading into the second leg. On arrival in Istanbul, though, it became clear that United were not facing an easy task. The players were met by a mob of fans at the airport, who loudly chanted “No way home” and carried signs bearing intimidatory slogans, such as the infamous “Wellcome to the hell” (sic). Many travelling fans found themselves detained by police on spurious grounds, preventing them from attending the match. The game itself was played in a raucous atmosphere, lit by the constant glow of fan flares, with the home team taking great delight in using all of the tricks of the trade (although the term ‘shithousery’ is relatively recent, the behaviour it captures has a long pedigree) to knock their more illustrious opponents off their game. The game, which ended 0-0 to secure the Turkish side’s progression on away goals, frequently descended into rancour, ending with altercations between Turkish riot police and United’s players and staff. When asked about the experience afterwards, Ferguson pointedly quipped “I’ll no’ be going back” (although he did, when United again drew Galatasaray in the following year’s competition).
The failure of the English champions, who were then already running away with the following year’s title, to overcome a side from a country who England’s national team had twice beaten 8-0 in the previous decade seemed emblematic of the struggles of the English game to hold its place against rival leagues. The fact the tie came just weeks after a 2-0 defeat for England against the Netherlands had all but confirmed that Graham Taylor’s side would not appear at the 1994 World Cup compounded the sense of England’s status as being on the periphery of the European game.
There was, then, something of a feeling of having a point to prove in United’s run to the trophy in 1999. Yes, English football had clearly moved out of its early-1990s doldrums, with fine performance by the national team at Euro 96 and the continued development of the Premier League starting to draw great players in from overseas, but triumph at the top club level in Europe was still missing. So, even for English fans who were typically fervent ABUs (Anyone But United), the fact that they could pull off results like the victory in Turin over a side containing the likes of Zinedine Zidane, Edgar Davids and Didier Deschamps contained a thrill as a vindication of English football’s resurgence.
Compare that with the current moment, when clubs throughout the Premier League have purchasing power that rivals or surpasses clubs anywhere else on the continent, making England the place where the world’s top players want to be. City, even before their success, were regarded by most as the pre-eminent European club side and were clear betting favourites at the start of last season’s Champions League. There was, then, less of a sense that City were grappling with a challenge that could possibly still be beyond them, less of a feeling after the final that they had overcome the odds to be there. Football in Europe is very different now and English clubs are situated in a position where success is expected, rather than being a dream.
TLDR: who’s better?
It’s quite clear throughout everything I’ve looked at that this City team has the edge in terms of performance: they dominate games more thoroughly, meaning their success always felt more assured and the gap between them and their closest competitors, both domestically and in Europe, felt wider.
But if you were to ask me which season I would rather relive as a fan of one of these teams, or even as a neutral onlooker? United. Every time, no question. The degree of unpredictability that characterised their treble season gave the games a visceral charge that often feels missing from much of the top level of contemporary football. To be clear, this is less a comment on the two teams than the game itself. The underlying financial tectonic plates have shifted over the past 25 years, in a way that enables Premier League clubs to attract eyeballs and funding from across the globe, opening up the potential for previously unimaginable levels of dominance. Don’t get me wrong, this City side is superb and their success is far from inevitable: those involved in the football operations at the club have not simply relied on exercising financial muscle, but have strategically developed an intelligent set-up, capped by superlative coaching. They play attractive football in a devastatingly effective way that can be a pleasure to watch. But ultimately, no matter how finely crafted the details of its construction, there will always be some missing element of true sporting joy when you remind yourself that what you are watching is the world’s most well-resourced football club smash aside all-comers without ever really looking like they have to extend themselves.
This post offers an overall analysis of the findings of ITMH’s competitive inequality project, tracking the impact of financial inequality upon football. The introductory post explains the measures that are used in the analysis. Individual commentary posts follow, discussing top flight football in Germany, Italy, Spain and England.
Each of the individual league commentaries has noted trends across the four measures of competition I am tracking. But what can be said about the overall picture? Are there any general messages within the data? For each measure, I’ll include a chart showing the rolling averages for each of the leagues plotted alongside each other (they always look a bit messy, but can give some indications of cross league performance) then an overall average of the measure across all four leagues.
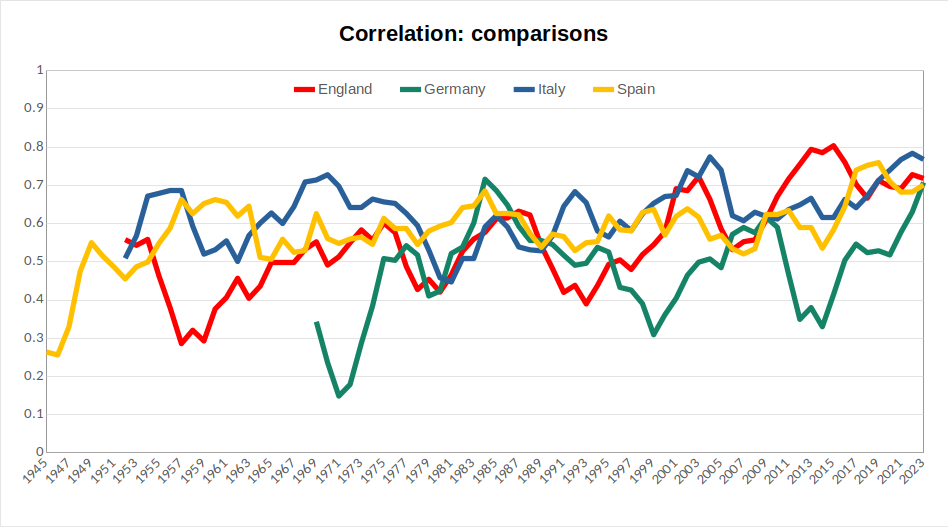
Fig 1: correlation comparison
(Lines here display five-year rolling averages for the correlation value between each season’s finishing positions and those in the preceding season for each of the four leagues discussed. See the introductory post to this series for an explanation of the choice of measurements.)
As noted in the individual commentaries, the Italian league has typically displayed slightly higher levels of year-to-year consistency, while the German and English leagues have been more prone to periods of real flux. All four leagues currently display correlation levels well above historical averages.
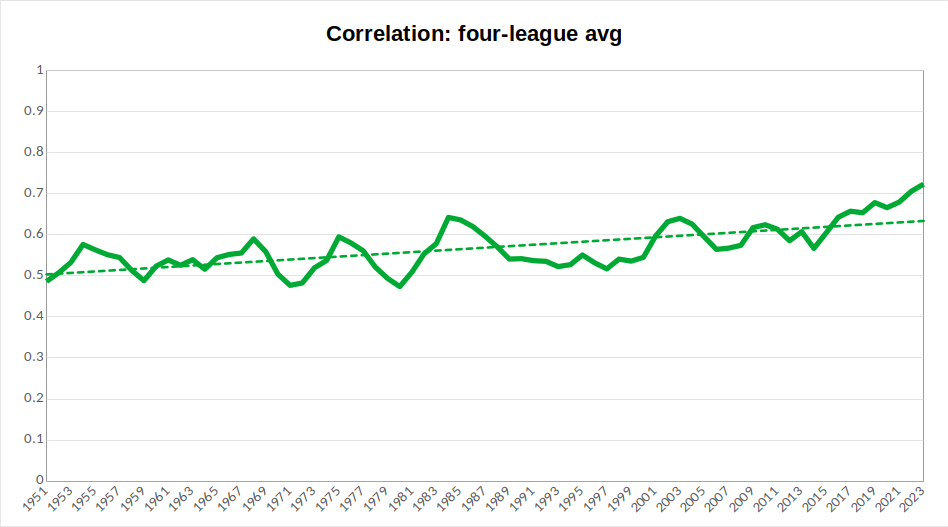
Fig 2: correlation overall average
(The line here displays a five-year rolling average of an average correlation value between each season’s finishing positions and those in the preceding season for each of the four leagues discussed. The dotted line indicates the overall trend in this measure. See the introductory post to this series for an explanation of the choice of measurements.)
An average across the four countries smooths out some of the variation to show a general rising trend across all leagues, indicating less fluidity of finishing positions. Furthermore, at present, the five year rolling average sits well above the trendline, which indicates that this is a trend that may currently be intensifying.
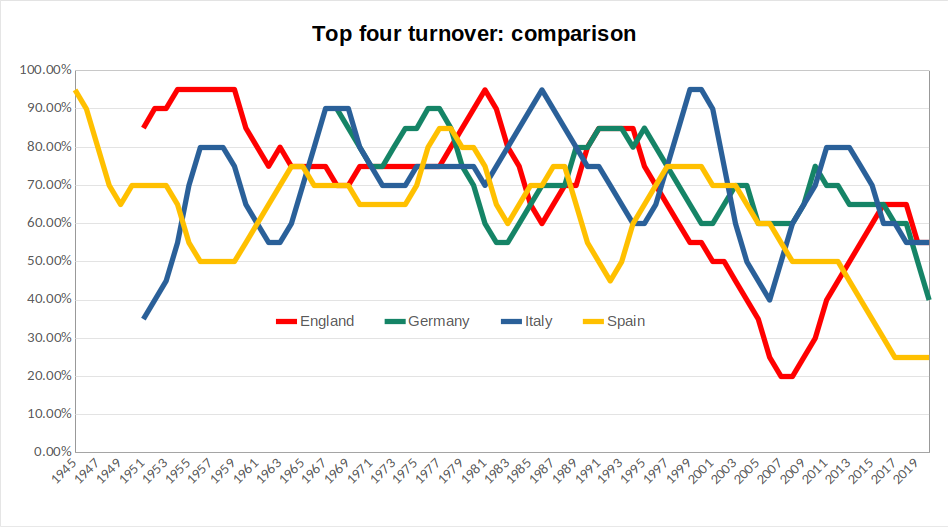
Fig 3: top four turnover comparison
(Lines here represent five-year rolling averages for each of the four leagues of the top four turnover measure, assessing levels of variation among clubs finishing in the top four of each league. See the introductory post to this series for an explanation of the choice of measurements.)
The most notable collective trend across the individual results is that each league has seen periods of sharp decline since the mid-1990s. In England, this is followed by something of a rebound (marking the emergence of a financial Big Six, which created greater competition for top four places), in Spain the decline is steady and continuous, in Italy there remains greater scope for variation.
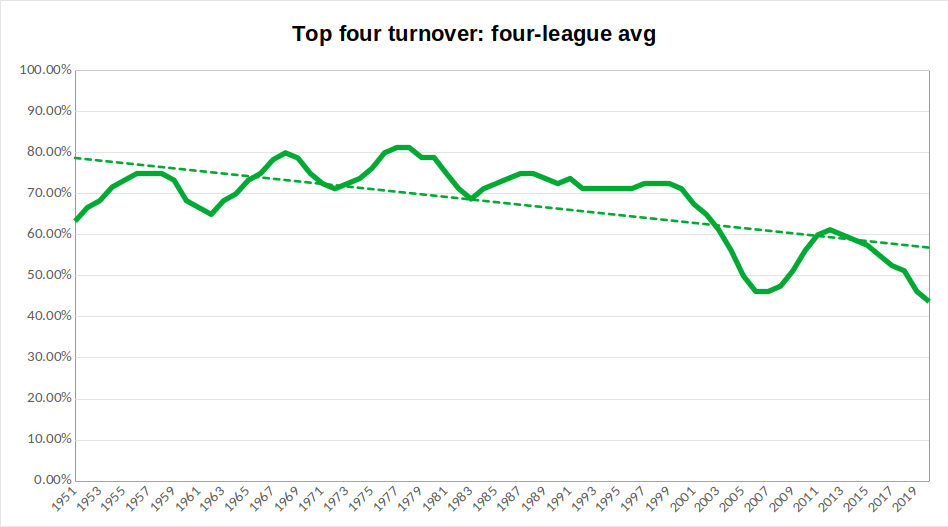
Fig 4: top four turnover overall average
(The line here displays a five-year rolling average of an average of the top four turnover measure, assessing levels of variation among clubs finishing in the top four of each league. The dotted line indicates the overall trend in this measure. See the introductory post to this series for an explanation of the choice of measurements.)
The overall average confirms the above trend: the overall direction of travel is downwards, but this is more marked from around 2000 onwards. Given that this was the point at which the Champions League was opened up to more teams from the biggest leagues, we can point to a clear effect of format changes at the continental level: the wealth attained through big club participation in Europe’s most prestigious competition allows these clubs to maintain a more stable grasp upon the top positions in their domestic leagues. As with correlation measure, the rolling average here sits below the overall trend, indicating this impact is intensifying. With further reform to the Champions League format, potentially enabling greater rewards for participants, even further decline in this measure is possible.
Fig 5: top six turnover comparison
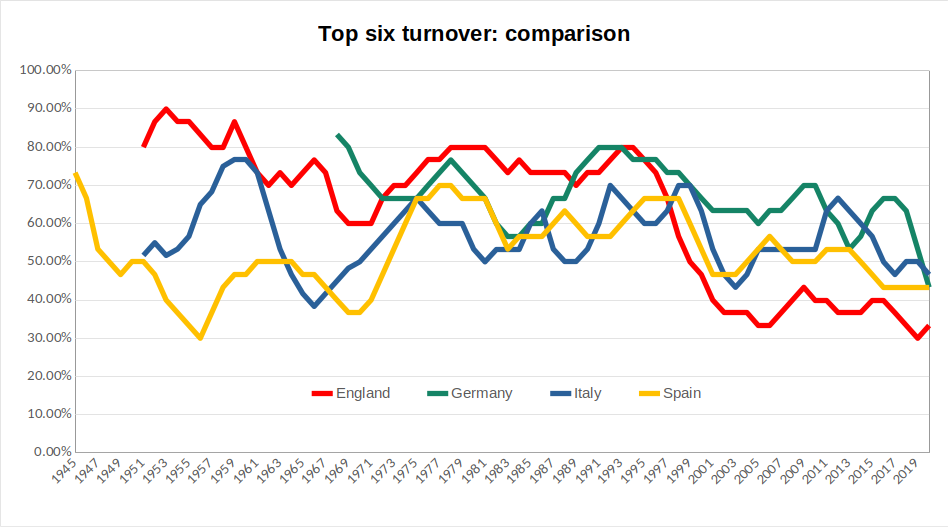
(Lines here represent five-year rolling averages for each of the four leagues of the top six turnover measure, assessing levels of variation among clubs finishing in the top six of each league. See the introductory post to this series for an explanation of the choice of measurements.)
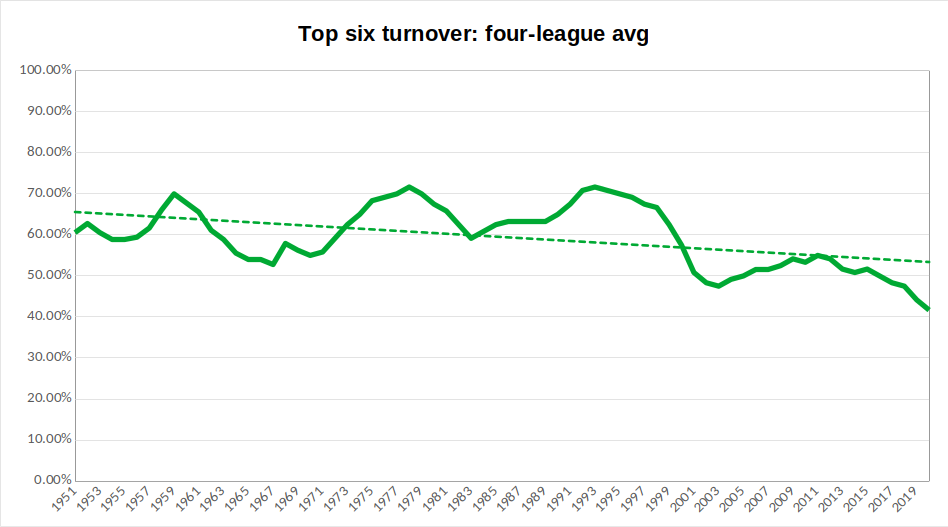
Fig 6: top six turnover overall average
(The line here displays a five-year rolling average of an average of the top four turnover measure, assessing levels of variation among clubs finishing in the top six of each league. The dotted line indicates the overall trend in this measure. See the introductory post to this series for an explanation of the choice of measurements.)
A similar effect is noticeable in the top six turnover measure. Prior to around 1995, there is no real collective trend in the results. Since then, to different degrees, all four leagues have seen decline in this measure. As a result, the decline in the overall average is notable and appears to currently be intensifying.
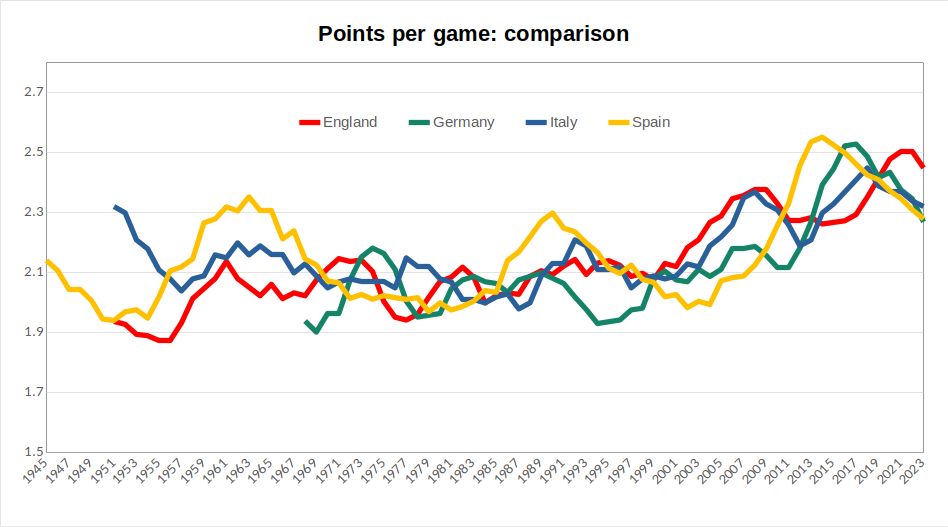
Fig 7: champions’ points per game comparison
(Lines here represent five-year rolling averages for each league of the points won per game by the team that finished champions. See the introductory post to this series for an explanation of the choice of measurements.)
In the individual commentaries, I highlighted the way that measures of dominance for championship winners enable some individual teams to be picked out. We can again, for instance, pick out the pinnacles of Real Madrid in the late 1950s/early 1960s and again in the late 1980s. But, beyond this, what is more apparent is that the recent steep rises in performance are consistent across the leagues, rather than being obviously attributable to individual teams. All four leagues have seen peaks of performance in the past fifteen years that surpass anything seen before.
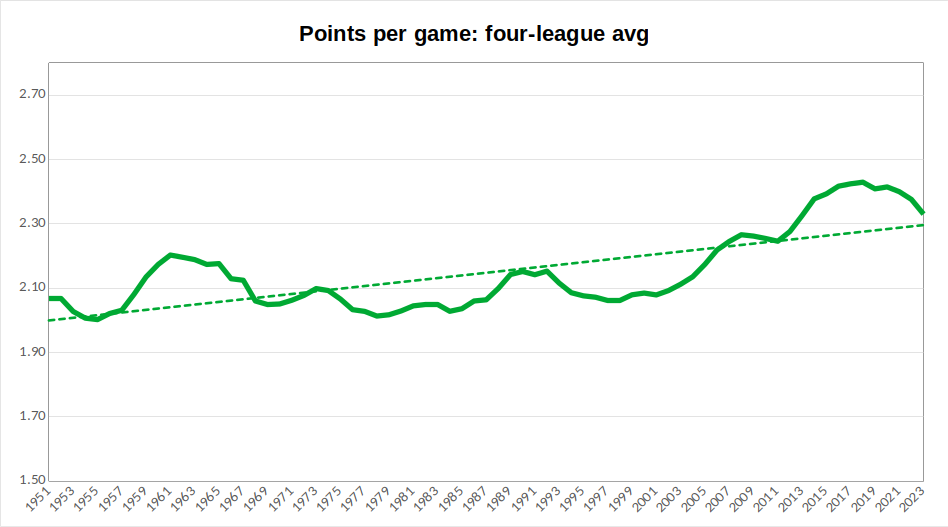
Fig 8: champions’ points per game overall average
(The line here displays a five-year rolling average of an average across the four leagues of points won per game by the team that finished champions. The dotted line indicates the overall trend in this measure. See the introductory post to this series for an explanation of the choice of measurements.)
When I was young, I remember my Dad trying to instruct me of the value of a hard-earned away draw by saying that a team who won all of their home games and drew all of their away games would win the league. Now, the averages here show that, while a title victory would not be entirely certain across these leagues, a two points per game average would certainly have made a team a contender up until about twenty years ago. Since then, it would leave you trailing some way back. So, alongside winning all home games, a team today would probably also need to win about one-third of those away and draw the rest in order to accumulate enough points to pick up a title.
Now, it is worth noting that the past few seasons display some regression in this measure. Is this a sign that we had reached unsustainable levels of dominance, or is it perhaps due to the financial hit taken by many of the big clubs through the pandemic? This is something to monitor in future years.
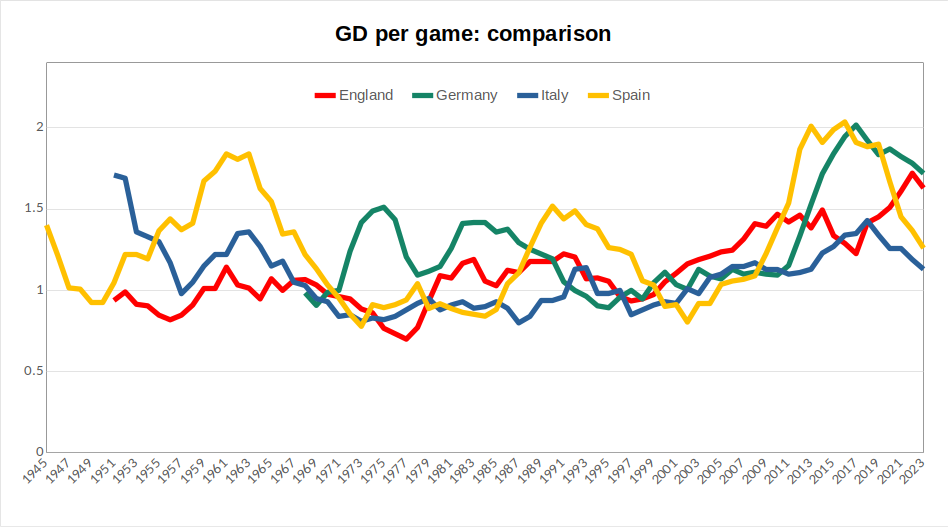
Fig 9: champions’ goal difference per game comparison
(Lines here represent five-year rolling averages for each league of the average goal difference per game of the team that finished champions. See the introductory post to this series for an explanation of the choice of measurements.)
While the overall shape of this chart is similar to that of points per game, with the performance of great teams visible a various different points, followed by a general recent rise, it is notable that the recent performance of Spanish and German champions jumped well clear of the other two leagues before both regressing. It can also be seen that, despite this season being poor by their recent standards, results here would point to Bayern still being the most dominant of the champions of the respective leagues.
Fig 10: champions’ goal difference per game overall average
(The line here displays a five-year rolling average of an average across the four leagues of the average goal difference per game of the team that finished champions. The dotted line indicates the overall trend in this measure. See the introductory post to this series for an explanation of the choice of measurements.)
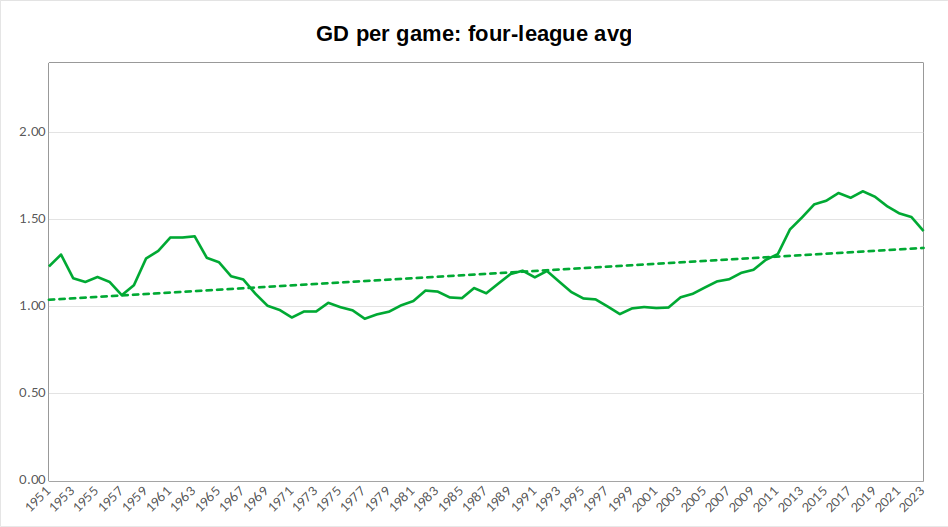
As I discussed in the Spanish and Italian commentaries, the period prior to the mid-1960s was one marked by some flamboyant champions. This is something that registers in the overall average here in values that would not be surpassed for another half a century. Recent years have seen champions of the four leagues consistently recording average goal difference of over 1.5 goals per game. The same kind of recent regression seen in respect to average points won is also visible here, so champions are not exerting quite the same level of dominance they managed across the 2010s.
Summary
Across all measures here, support can be found for the conclusion that competition within domestic leagues is profoundly influenced by the format of European competitions. The opening up of the Champions League to non-champions in 1997, then the shift to up to four teams qualifying from top leagues in 1999 corresponds to noticeable upswings in the average correlation of finishing positions, lower turnover in top four and top six finishers, alongside more dominant performances by champions.
In other words, dominance over the past 20 years is different to the dominance of Real Madrid in the late 1950s or Bayern Munich in the 1970s: there is a deeper structural foundation to it in terms of the way the Champions League allows for a massive concentration of financial power in the hands of the continent’s elite clubs, which makes it easier for them to defend their status from domestic challengers. And, with the coming expansion of the Champions League format, the structural unfairness visible within these figures has potential to deepen even further.
This post analyse the Premier League, as part of ITMH’s competitive inequality project, tracking the impact of financial inequality upon football. The introductory post explains the measures that are used in the analysis. See the other posts in this series for commentary on top flight football in Germany, Italy and Spain, or the overall discussion of trends within Europe’s top leagues.
English football has generally been more competitive than Europe’s other main leagues, with its biggest teams exerting less of a stranglehold than elsewhere. Its most successful league side, Manchester United, have 20 titles, whereas in each of Spain, Italy and Germany, the most prominent team has won more than 30 trophies. Across the periods I am tracking in this exercise, England has had 17 different champions, equating to a new club winning the title on average every 4.53 seasons. In the Bundesliga, the average is for a new champion every 4.62 seasons, in Serie A it is 6.42 seasons and in La Liga, where only eight different clubs have won titles since the end of the Civil War, the average is 10.5 seasons.
(You might at this point be thinking that this difference is largely attributable to the period before the formation of the Premier League. However, even since that point (1992-93 onwards), English football has seen more different champions than other leagues, with seven (Manchester United, Blackburn, Arsenal, Chelsea, Manchester City, Leicester and Liverpool), compared to six in Germany and Italy, five in Spain.)
Similarly, with Manchester City’s win at the weekend, England now have supplied six different winners of the European Cup/Champions League – double that of the German or Italian leagues, treble that of La Liga. Equally, England supplied more of the clubs involved in the European Super League proposals, with six (the two Manchester clubs, Liverpool, Chelsea, Arsenal and Tottenham).
This greater competitive openness is one key contributor to the global success of the Premier League. Fans from abroad, entirely unconstrained by ties of community or locality, will tend towards following a larger club with a glorious history, and superstar players that ensure it competes regularly for trophies. Yet, the fact that the English league offers multiple such options provides it with greater interest: more crucial clashes with other significant teams, greater scope for banter with other fans, a wider set of different clubs who can entertain hopes of success. At present, therefore, English football commands higher global audiences, bringing greater revenue from television rights, which in turn makes its clubs the most attractive trinkets as billionaire playthings or soft-power vehicles for reputationally compromised petro-states. This cycle (I’ll leave it up to you to make a value judgement over whether it is virtuous or vicious) has given English clubs (and not just those at the very top) spending power that few are able to match elsewhere.
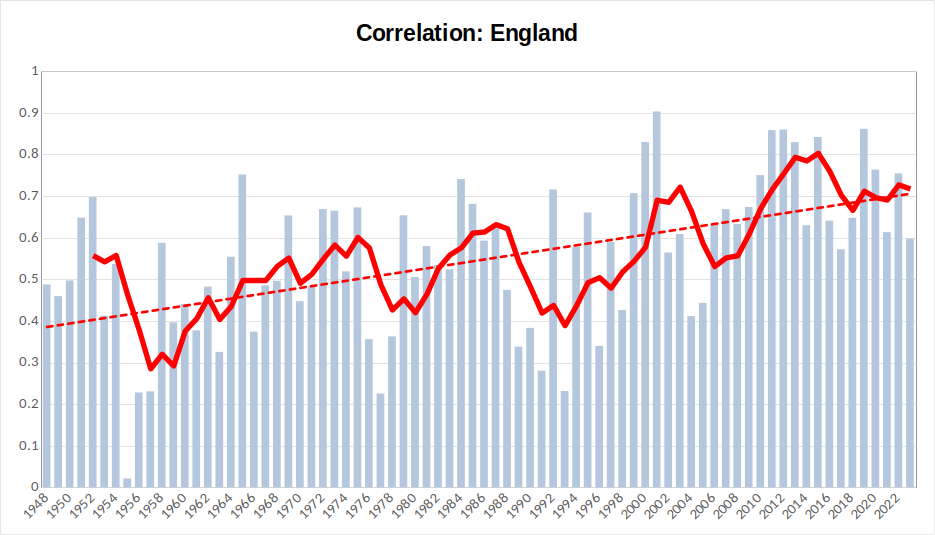
Fig 1: correlation
(Bars here represent the individual correlation value between each season’s finishing positions and those in the preceding season. The red line is a five-year rolling average to pick up on trends in the medium term. The dotted line is an overall trendline representing the overall direction of travel for this measure across the results. See the introductory post to this series for an explanation of the choice of measurements.)
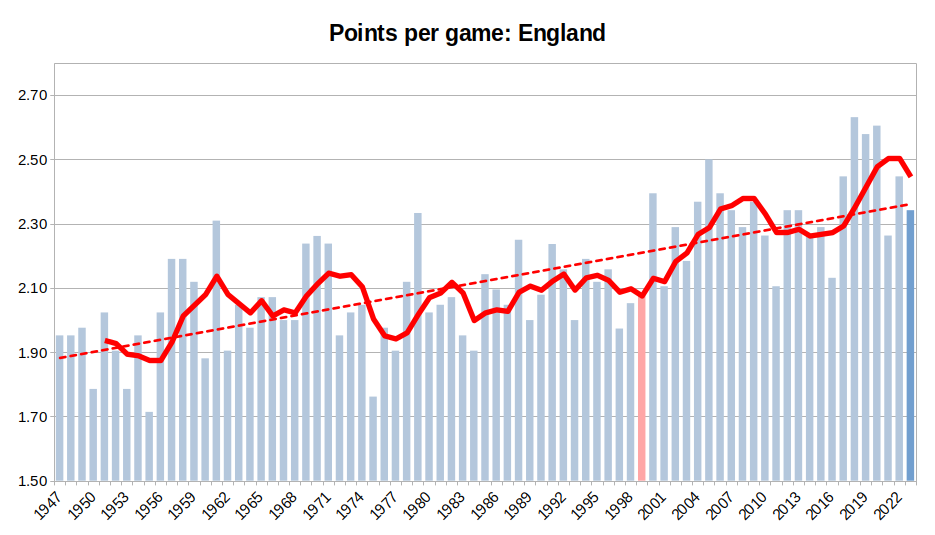
The easiest way to appreciate the findings of this chart is to begin by focussing on this season’s Premier League standings. Yes, Manchester City claimed the title again (for the fifth time in six years), but otherwise, the table this year felt full of surprises: Arsenal and Newcastle finished in the Champions League places, Liverpool and (more spectacularly) Chelsea did not; Brighton, Villa, Brentford and Fulham all recorded impressively high finishes, Leicester, Everton and West Ham under-performed their recent records. Now look at the correlation figure for this season: a hair shy of 0.6. The only recent year with a lower figure is 2016 (when, amongst other things, Leicester jumped from 14th position to 1st, while Chelsea dropped from 1st to 10th). Yet, trace the 0.6 line further back and you will see that, prior to the start of the 21st century, a year-to-year correlation in finishing positions of 0.6 would actually have indicated a relatively high figure, with finishing positions frequently characterised by much greater volatility. We can see from this that the past 20 years have been a period of significantly greater league stability and predictability than what had come before.
Across the chart, while the rolling average takes a jagged saw-tooth shape, the overall trend is clearly one of a steady increase in correlation, showing that the league has become less open and fluid.
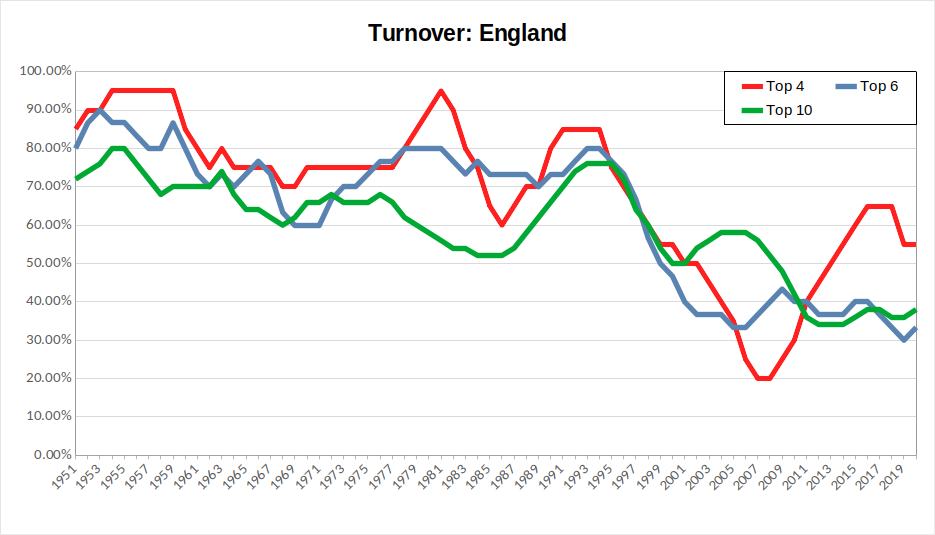
Fig 2: turnover
(Lines here represent five-year rolling averages for the turnover measure, assessing levels of variation among clubs finishing in the top two, top four, top six and top ten (in seasons with a 20+ team league) of the league. NB – since the calculation of this measurement relies upon future finishing positions, the current season’s figure can only be known in three year’s time. The latest figure, therefore, is for the 2019-20 season. See the introductory post to this series for an explanation of the choice of measurements.)
The turnover chart, if anything offers even more stark evidence of the change in English football in recent decades. From the mid-1990s (shortly after the formation of the Premier League), turnover among the top four, top six and top half of the league steeply drops away. The emergence of Manchester City and (to a lesser extent) Tottenham as challengers at the top is responsible for the rebound in top four turnover from the late 2000s onwards – when it had, for a while, looked as though Manchester United, Chelsea, Arsenal and Liverpool were taking almost total control of these places. Yet, it remains the case that the upper parts of the Premier League have become dominated by a small group of clubs. We shall have to see whether this season, in which some teams other than the usual suspects were prominent in the Premier League’s upper reaches, was more of a blip or a sign of new long-term challengers (such as Saudi-backed Newcastle United) emerging.
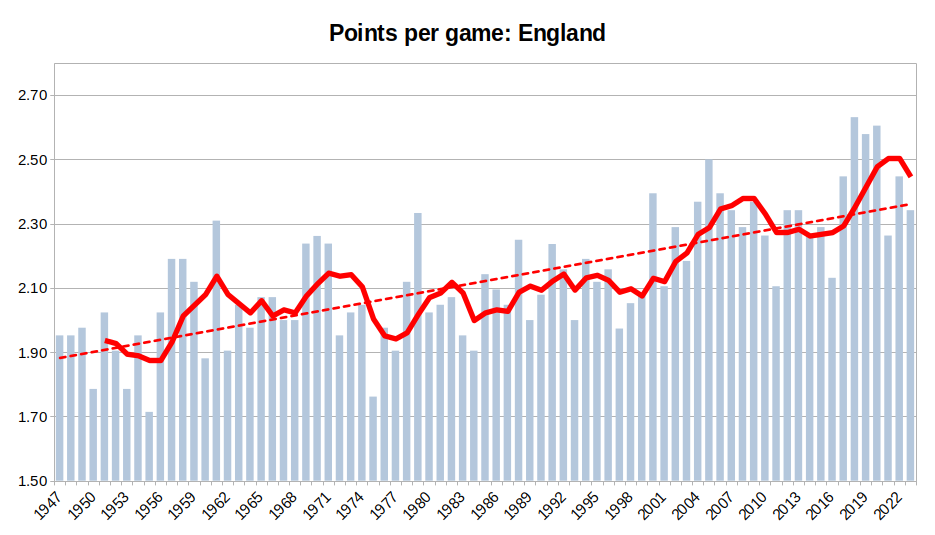
Fig 3: points per game
(Bars here represent the average points won per game by the team that finished champions that season. The red line is a five-year rolling average to pick up on trends in the medium term. The dotted line is an overall trendline representing the overall direction of travel for this measure across the results. See the introductory post to this series for an explanation of the choice of measurements.)
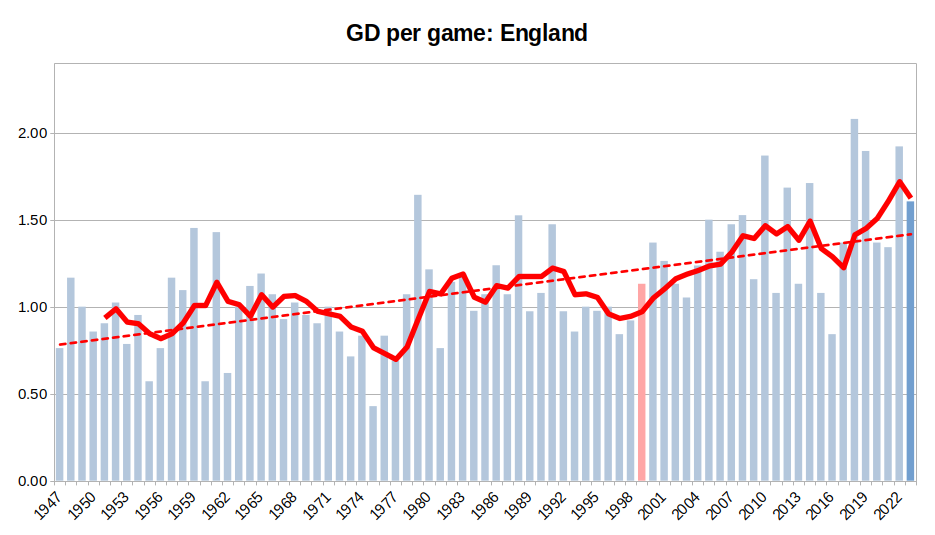
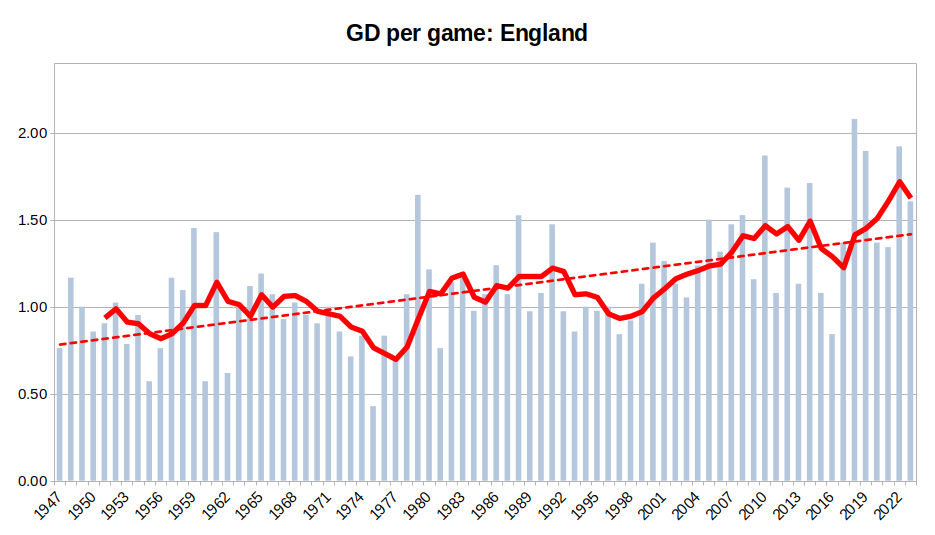
Fig 4: goal difference per game
(Bars here represent the average goal difference per game recorded by each season’s title winners. The red line is a five-year rolling average to pick up on trends in the medium term. The dotted line is an overall trendline representing the overall direction of travel for this measure across the results. See the introductory post to this series for an explanation of the choice of measurements.)
The charts for English champions are less of a tale of specific great teams than those of the continent’s other major leagues (although, on both charts, Liverpool’s team of 1978-79 stands out as something out of the ordinary), but instead that of a steadily rising trend in performance, becoming particularly strong from 2000 onwards and peaking (for now, at least) in the season of Pep Guardiola’s first Manchester City title win in 2017-18.
Summary
The above results are pretty unsurprising for any English football fan. Since the formation of the Premier League in 1992 and the opening up of the Champions League to allow multiple teams from larger leagues from the late 1990s onwards, there have been marked trends for less fluidity in finishing positions, dominance of higher positions by a select group of clubs and higher levels of sustained performance by title winners. All of these are indications that the increasing inequality in English football are harming the levels of competitive openness that have been one of its selling points.