
This post analyse the Premier League, as part of ITMH’s competitive inequality project, tracking the impact of financial inequality upon football. The introductory post explains the measures that are used in the analysis. See the other posts in this series for commentary on top flight football in Germany, Italy and Spain, or the overall discussion of trends within Europe’s top leagues.
English football has generally been more competitive than Europe’s other main leagues, with its biggest teams exerting less of a stranglehold than elsewhere. Its most successful league side, Manchester United, have 20 titles, whereas in each of Spain, Italy and Germany, the most prominent team has won more than 30 trophies. Across the periods I am tracking in this exercise, England has had 17 different champions, equating to a new club winning the title on average every 4.53 seasons. In the Bundesliga, the average is for a new champion every 4.62 seasons, in Serie A it is 6.42 seasons and in La Liga, where only eight different clubs have won titles since the end of the Civil War, the average is 10.5 seasons.
(You might at this point be thinking that this difference is largely attributable to the period before the formation of the Premier League. However, even since that point (1992-93 onwards), English football has seen more different champions than other leagues, with seven (Manchester United, Blackburn, Arsenal, Chelsea, Manchester City, Leicester and Liverpool), compared to six in Germany and Italy, five in Spain.)
Similarly, with Manchester City’s win at the weekend, England now have supplied six different winners of the European Cup/Champions League – double that of the German or Italian leagues, treble that of La Liga. Equally, England supplied more of the clubs involved in the European Super League proposals, with six (the two Manchester clubs, Liverpool, Chelsea, Arsenal and Tottenham).
This greater competitive openness is one key contributor to the global success of the Premier League. Fans from abroad, entirely unconstrained by ties of community or locality, will tend towards following a larger club with a glorious history, and superstar players that ensure it competes regularly for trophies. Yet, the fact that the English league offers multiple such options provides it with greater interest: more crucial clashes with other significant teams, greater scope for banter with other fans, a wider set of different clubs who can entertain hopes of success. At present, therefore, English football commands higher global audiences, bringing greater revenue from television rights, which in turn makes its clubs the most attractive trinkets as billionaire playthings or soft-power vehicles for reputationally compromised petro-states. This cycle (I’ll leave it up to you to make a value judgement over whether it is virtuous or vicious) has given English clubs (and not just those at the very top) spending power that few are able to match elsewhere.
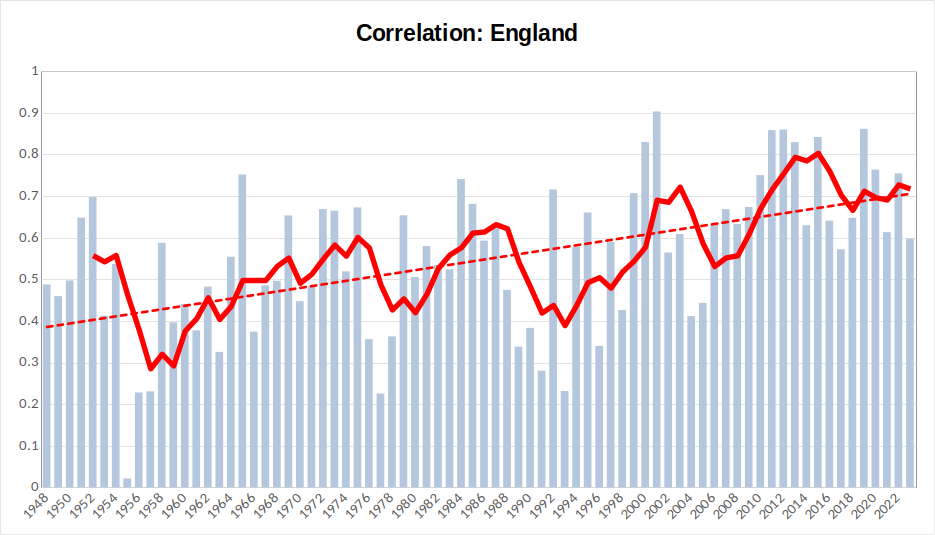
Fig 1: correlation
(Bars here represent the individual correlation value between each season’s finishing positions and those in the preceding season. The red line is a five-year rolling average to pick up on trends in the medium term. The dotted line is an overall trendline representing the overall direction of travel for this measure across the results. See the introductory post to this series for an explanation of the choice of measurements.)
The easiest way to appreciate the findings of this chart is to begin by focussing on this season’s Premier League standings. Yes, Manchester City claimed the title again (for the fifth time in six years), but otherwise, the table this year felt full of surprises: Arsenal and Newcastle finished in the Champions League places, Liverpool and (more spectacularly) Chelsea did not; Brighton, Villa, Brentford and Fulham all recorded impressively high finishes, Leicester, Everton and West Ham under-performed their recent records. Now look at the correlation figure for this season: a hair shy of 0.6. The only recent year with a lower figure is 2016 (when, amongst other things, Leicester jumped from 14th position to 1st, while Chelsea dropped from 1st to 10th). Yet, trace the 0.6 line further back and you will see that, prior to the start of the 21st century, a year-to-year correlation in finishing positions of 0.6 would actually have indicated a relatively high figure, with finishing positions frequently characterised by much greater volatility. We can see from this that the past 20 years have been a period of significantly greater league stability and predictability than what had come before.
Across the chart, while the rolling average takes a jagged saw-tooth shape, the overall trend is clearly one of a steady increase in correlation, showing that the league has become less open and fluid.
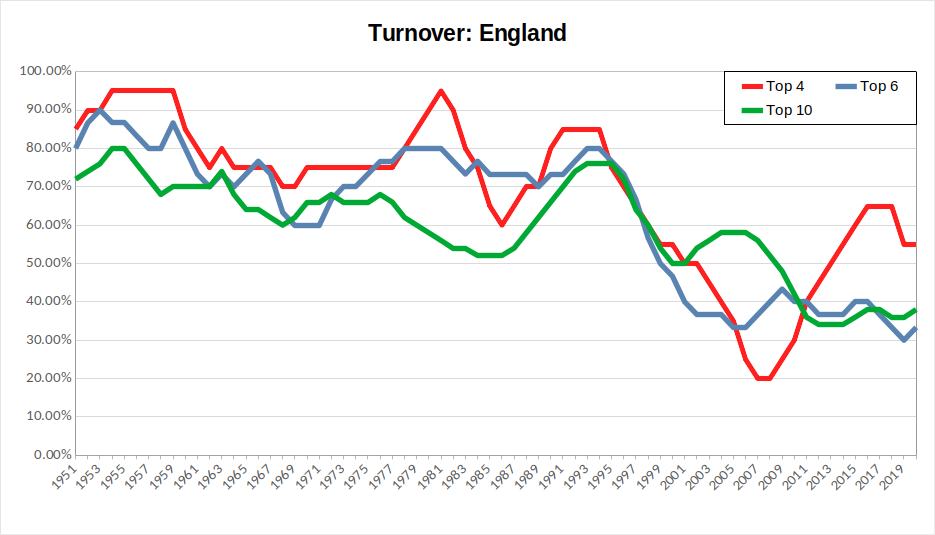
Fig 2: turnover
(Lines here represent five-year rolling averages for the turnover measure, assessing levels of variation among clubs finishing in the top two, top four, top six and top ten (in seasons with a 20+ team league) of the league. NB – since the calculation of this measurement relies upon future finishing positions, the current season’s figure can only be known in three year’s time. The latest figure, therefore, is for the 2019-20 season. See the introductory post to this series for an explanation of the choice of measurements.)
The turnover chart, if anything offers even more stark evidence of the change in English football in recent decades. From the mid-1990s (shortly after the formation of the Premier League), turnover among the top four, top six and top half of the league steeply drops away. The emergence of Manchester City and (to a lesser extent) Tottenham as challengers at the top is responsible for the rebound in top four turnover from the late 2000s onwards – when it had, for a while, looked as though Manchester United, Chelsea, Arsenal and Liverpool were taking almost total control of these places. Yet, it remains the case that the upper parts of the Premier League have become dominated by a small group of clubs. We shall have to see whether this season, in which some teams other than the usual suspects were prominent in the Premier League’s upper reaches, was more of a blip or a sign of new long-term challengers (such as Saudi-backed Newcastle United) emerging.
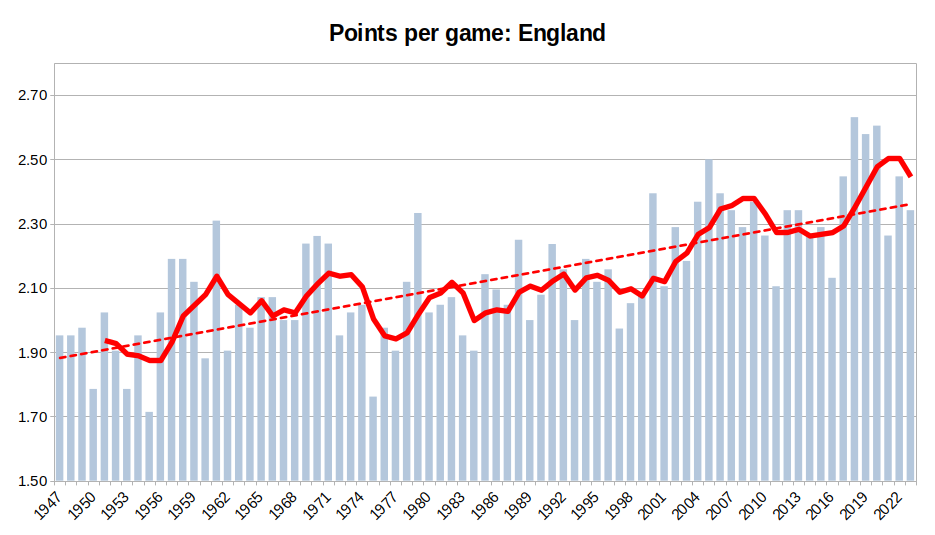
Fig 3: points per game
(Bars here represent the average points won per game by the team that finished champions that season. The red line is a five-year rolling average to pick up on trends in the medium term. The dotted line is an overall trendline representing the overall direction of travel for this measure across the results. See the introductory post to this series for an explanation of the choice of measurements.)
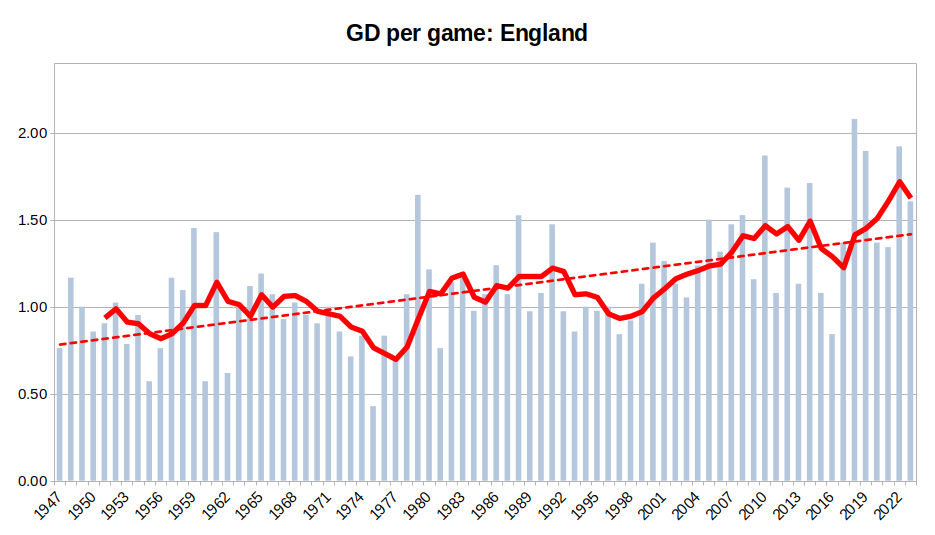
Fig 4: goal difference per game
(Bars here represent the average goal difference per game recorded by each season’s title winners. The red line is a five-year rolling average to pick up on trends in the medium term. The dotted line is an overall trendline representing the overall direction of travel for this measure across the results. See the introductory post to this series for an explanation of the choice of measurements.)
The charts for English champions are less of a tale of specific great teams than those of the continent’s other major leagues (although, on both charts, Liverpool’s team of 1978-79 stands out as something out of the ordinary), but instead that of a steadily rising trend in performance, becoming particularly strong from 2000 onwards and peaking (for now, at least) in the season of Pep Guardiola’s first Manchester City title win in 2017-18.
Summary
The above results are pretty unsurprising for any English football fan. Since the formation of the Premier League in 1992 and the opening up of the Champions League to allow multiple teams from larger leagues from the late 1990s onwards, there have been marked trends for less fluidity in finishing positions, dominance of higher positions by a select group of clubs and higher levels of sustained performance by title winners. All of these are indications that the increasing inequality in English football are harming the levels of competitive openness that have been one of its selling points.